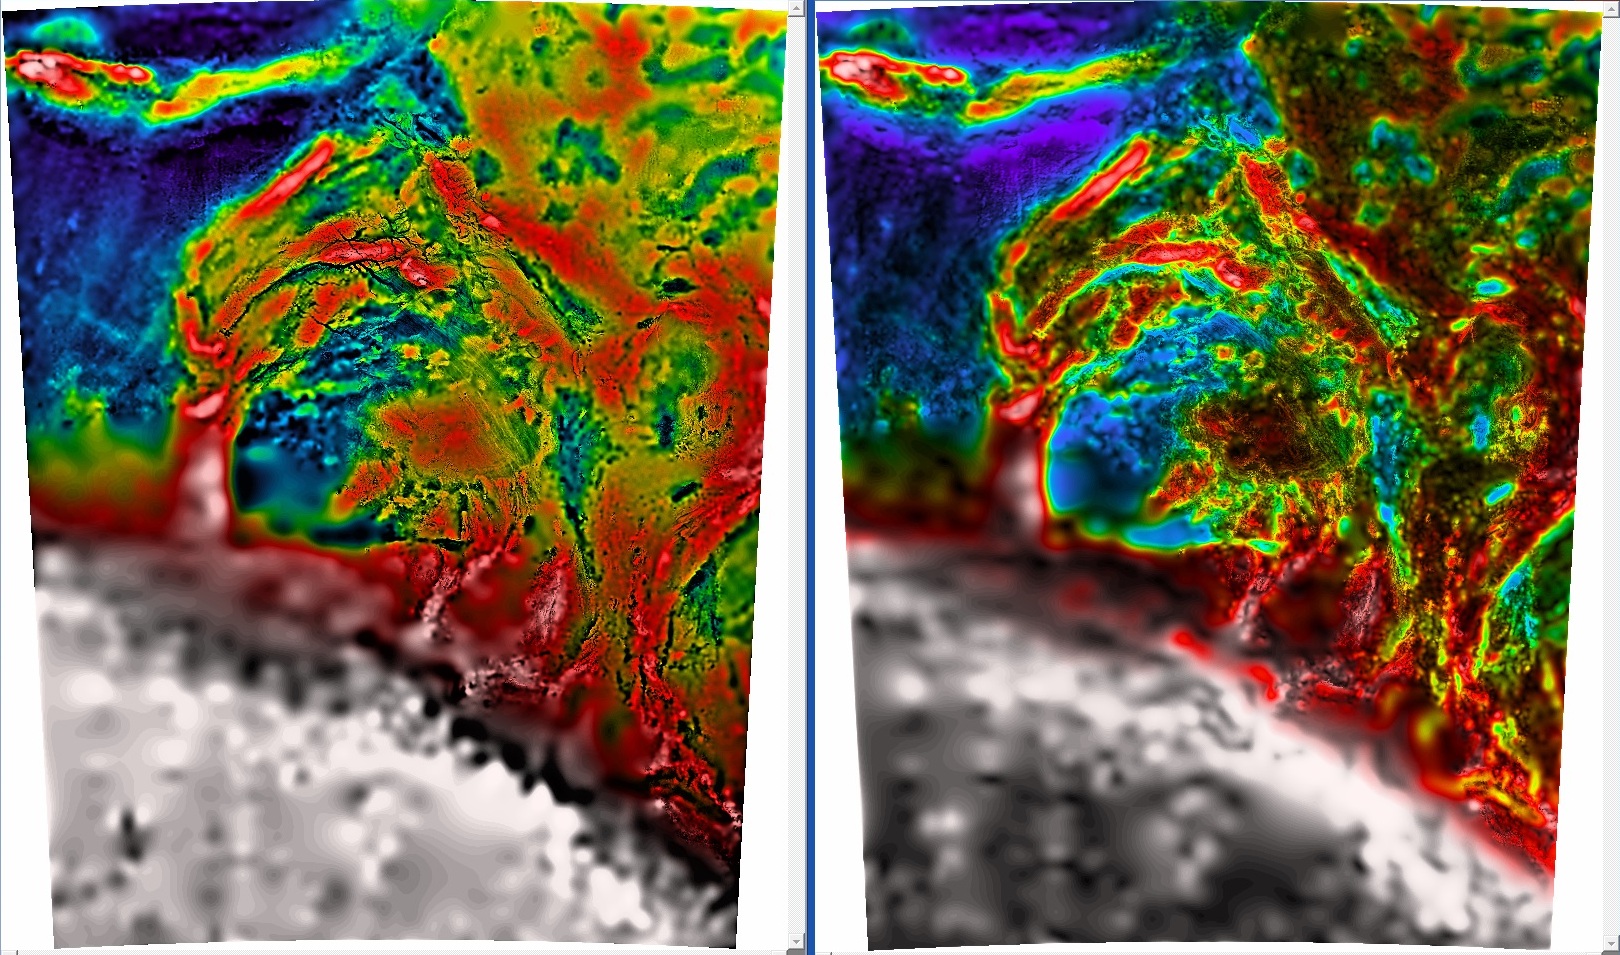
Curvature and Gravity 3 - Image Drapes
Left: Bouguer Gravity of South Australia with 1VD of Bouguer Gravity as Intensity. Right: Bouguer Gravity of South Australia with ASA of Bouguer Gravity as Intensity. Data: Geological Survey of South Australia. Imaging: M. Zengerer.
Hello Readers. This week we are returning to the theme of image enhancement of Gravity, with of course the ultimate objective of achieving the Gravitational Curvature Image seen in the first article. Our new discussion introduces the idea of Drapes, or Colour Drapes.
In the previous article I highlighted the fact that although the transform of a Bouguer Gravity (BG) dataset such as the First Vertical Derivative (or the 1VD) improves the high frequency content and sharpens local anomalies and structural features, we lose some ability to domain or classify the data through variations of the original BG values. In fact, the anomalies we are looking at would have dimensions no longer of mGals but mGals per metre. So we are now looking at the variation of a quantity in space (with elevation in fact) rather than the quantity itself, ie the "anomaly" is no longer the anomaly. This is perfectly fine on a conceptual level, if not a quantitative one. Whilst we can also increase high frequency content through the use of Gravity Residuals (a whole other topic), that is not the objective of these interpretation examples. I will go as far as to say, the days of bump hunting - ie looking for the biggest or smaller value - should end in favour of the much greater power of potential field data as a geological and structural mapping tool. Only after we interpret the context of the geological setting, are "bumps" actually meaningful. Anyway, I digress somewhat.
When we interpret a pseudo-coloured image, we are seeing a colour ranged image based on the values of the data. So for example the BG ranges from dark purples at -160 mGals, through blues at -40 mGals and reds at 10mGals up to whites beyond 100mGals. We don't have to use colour though. We can use greyscale, or black to white, to image intensity of a signal. So black is weak or low values and white is intense or high values. The Intensity image can be used to juxtapose or contrast against a Pseudocolour image, and the data (or band) for each image doesn't have to be the same, just related in some way. It turns out to make very good sense for interpretation to contrast a map of anomalies, against the spatial variation in the anomalies. In this fashion, the textural variation described by the higher frequency derivative dataset, becomes part of the natural variation of the source dataset. Furthermore, we can also now tell whether the original anomaly is due to a change that is strong or weak in its intensity. This has implications for understanding what the source of the anomaly - the geology - might be, as well as perceiving the structural enhancement of the high frequency image.
Compare the image on the left, which is our source dataset the Bouguer Gravity of South Australia. The pseudocolour is the BG, and the intensity is the 1VD of BG. No sunshade is required to perceive structural variation, the domaining is preserved, and the sources of anomalies are bright or weak according to their depth or density contrast and size. It almost looks a bit like we are beginning to "see through" the original image to get a new perspective on the geological variation in the Earth. Images that are created in this way, a single (or more) colour band plus a monotone intensity band, are called Drapes, or Colour Drapes. We are imagining that the Intensity image is like a surface, and we are painting the surface with a colour pattern that varies in a specific way in relation to the surface. This technique is used all the time in satellite imagery interpretation.
Another example is shown on the right. This time, we have the same pseudocolour BG data draped over a new intensity dataset: the Analytical Signal Amplitude (ASA) or Total Gradient of the Bouguer Gravity. The ASA has the same dimensions (mGal/m) as the 1VD, but is different in this regard: the 1VD is the change with respect to the vertical, but what about horizontal deviations in the gravity? These would be the derivatives in the X and Y (or East and North) directions, as well as the Z (or Down). The Total Gradient is the magnitude of all these variations summed together in a Pythagorean sense, ie the Square Root of the Sum of the Squares, ie BG ASA = √( (dG/dx)2+ (dG/dy)2 + (dG/dz)2 ) where G is representing the Bouguer Gravity and dG/dz for example is the same as the First Vertical Derivative in the z-direction. Note that as this is a square root, it is always a positive quantity, so strong low density changes and strong high density changes look similar - you need the original source to tell you which is occurring - hence the Drape. One major advantage in usefulness of this colour drape combination is that you receive a much clearer impression on how the geology is changing in all dimensions beneath the Bouguer Anomaly, not just in the vertical sense. We now have an even more 3D perspective sense in our visualisation, observe how both low density basins or intrusions, as well as high density rocks, are more clearly defined in this image, as well as a greater perspective on major structural changes such as folding, faulting, or thickening of cover sediments, are occurring.
We are creeping closer to the more advanced topic of Gradients and Tensors, which will be reviewed in the next article. Thanks for reading.