Curvature and Gravity 4 - Tensor Gradients
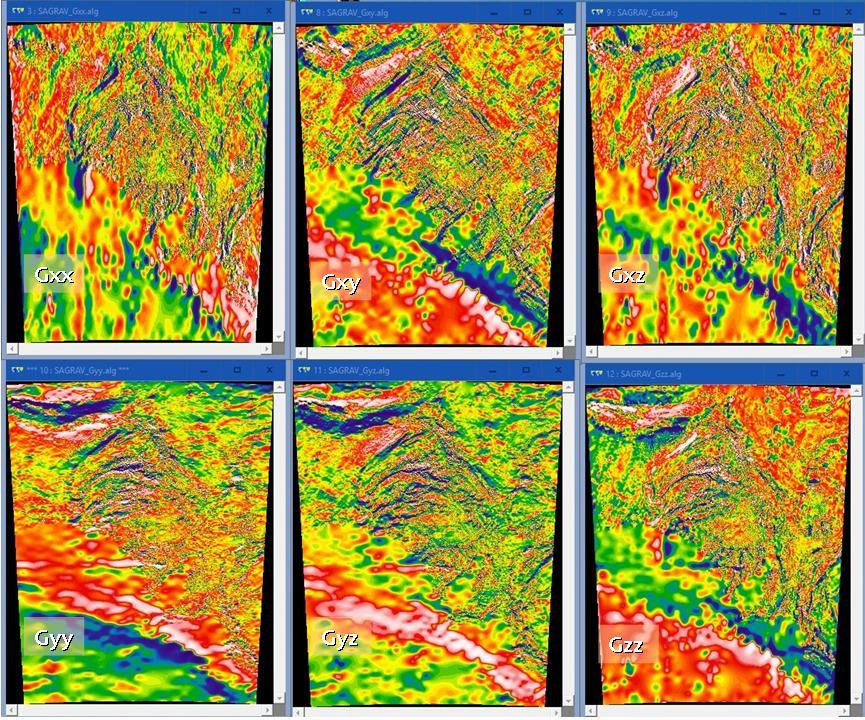
Clockwise from Top Left: Gravity Tensor Gradient Gxx, Gxy, Gxz, Gzz, Gyz, Gyy. Data: Geological Survey of South Australia. Imaging: M. Zengerer.
To advance further into the mysteries of potential field image enhancements and edge a little closer to our goal, it is now a pertinent idea to introduce more specific description of what we are actually looking at when we discuss such things as "First Vertical Derivative (1VD)", or "Analytical Signal Amplitude (ASA)". These two quantities are using, singularly or in combination, elements of what is known as the Gravity Tensor. Whilst I will leave more specific description to the many published papers on the topic to be found on the internet, for example this one: http://www.ga.gov.au/webtemp/image_cache/GA16642.pdf I will cover the main idea behind the concept.
Gravity is a Force (one of the four known Forces). A Force is mechanism for transporting Energy or Mass or Charge from one place to another. When we decide to move Mass (for example) from one place to another, it uses Energy. If we examine the amount of Energy used moving the Mass around more generally, then we observe that the amount of Energy will change depending where it is in space and how far it has to go. We describe the amount of Energy by a term known as the Potential and its distribution in space by a term called the Field. Gravitational Forces, which move mass around, therefore are changes in the Potential Field. These Gravitational Forces are multi-directional and can be described by vectors in the X,Y and Z dimensions, ie Gx, Gy and Gz, on the Earth, they are dominated by the vertical component Gz owing to the huge mass of the Earth pulling everything towards its centre. So when we measure gravity in the field, we are typically just measuring the vertical Gravity vector Gz.
As already discussed, we are not always interested in just the variation in the vertical gravity, but also in how that quantity varies. It turns out that Gz also varies in 3 directions, so we have 3 further quantities which measure small changes (or Gradients) in accelerations with respect to Z. These are the partial derivatives of Gz: Gzx, Gzy and Gzz. Although these variations are quite small in magnitude, the range can be quite large. The variations have units of s-2 and are given the term Eötvös. The same also applies for changes in the Gx and Gy horizontal gravity components, even though the forces in these directions are weaker, the variations in the forces are of equal significance to the variations in the vertical direction. Each of these vectors also varies in three directions, thus we have Gxx, Gxy, Gxz and Gyy, Gyx, Gyz. These 9 different components of changes in acceleration form a 3x3 matrix array known as the Gravity Gradient Tensor. The expression for the tensor Gij looks like this:
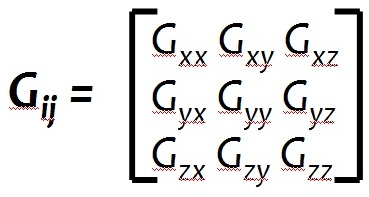
Tensors have a lot of interesting properties which can be exploited as we will see. One of the first things to note is that the Trace of the Tensor, which is the sum of the diagonal elements from top left to bottom right, is equal to zero for potential fields (Laplace's Equation), ie Gxx +Gyy +Gzz =0. The other main thing to note is that the Gij elements above the diagonal on the right are equal to the ones below the diagonal on the left, and thus as Gxx +Gyy = -Gzz only 5 elements are independent.
To examine what gravity gradient components of the tensor look like, observe the figure above where the vertical Bouguer Gravity for South Australia has been mathematically transformed into the principal tensor components. It is easy to see that, as expected, the Gzz is virtually equivalent to the 1VD of Bouguer Gravity and reflects vertical variations in the gravity gradient. Gxx and Gyy, being horizontal derivatives, show the geological trend variations in the North-South and East-West directions respectively. Gxz and Gyz represent the horizontal gradients with respect to the vertical and therefore tend to show where the Edges of anomalies are in the N-S/E-W directions, whilst Gxy shows the corners of anomalies.
Gravity Gradient data are collected by Airborne or Marine Gravity Gradiometry survey systems currently worldwide. However, how does one interpret such data? We have now travelled from looking at data in one dimension to looking at data representing 3 dimensions. Of the datasets shown above, only the Gzz (1VD) is directly correlative of the geological bodies beneath it and more simply interpretable. The other channels have a more indirect relationship. Nevertheless, we are now looking at a Multiband dataset of related quantities and there are special ways to visualise and interpret this information in powerful ways, which is the subject of the next pieces in this series.
Thanks again for reading.